
Last Refreshed: March 2026 with updated statistics, link fixes, and expert commentary.
Outbound call center metrics are the KPIs: including connection rate, conversion rate, CPA, calls per agent, and call quality: that measure how effectively your team generates leads through outbound calling. A research study by McKinsey found that 40% of respondents believe inbound calls will decrease drastically over the next ten years. That's why outbound lead generation has become a growing priority: it's more selective, personalized, and precisely targeted than any inbound channel. With outbound on the rise, B2B call centers that specialize in cold calling for outreach are thriving.
From Quincy Berg, SDR Operations Lead, CIENCE: "The metrics that separate high-performing outbound teams from average ones aren't always the obvious ones. Connection rate and conversion rate matter, but call quality scoring is what compounds. Teams that review calls systematically improve 30 to 40% faster than those that only watch the numbers."
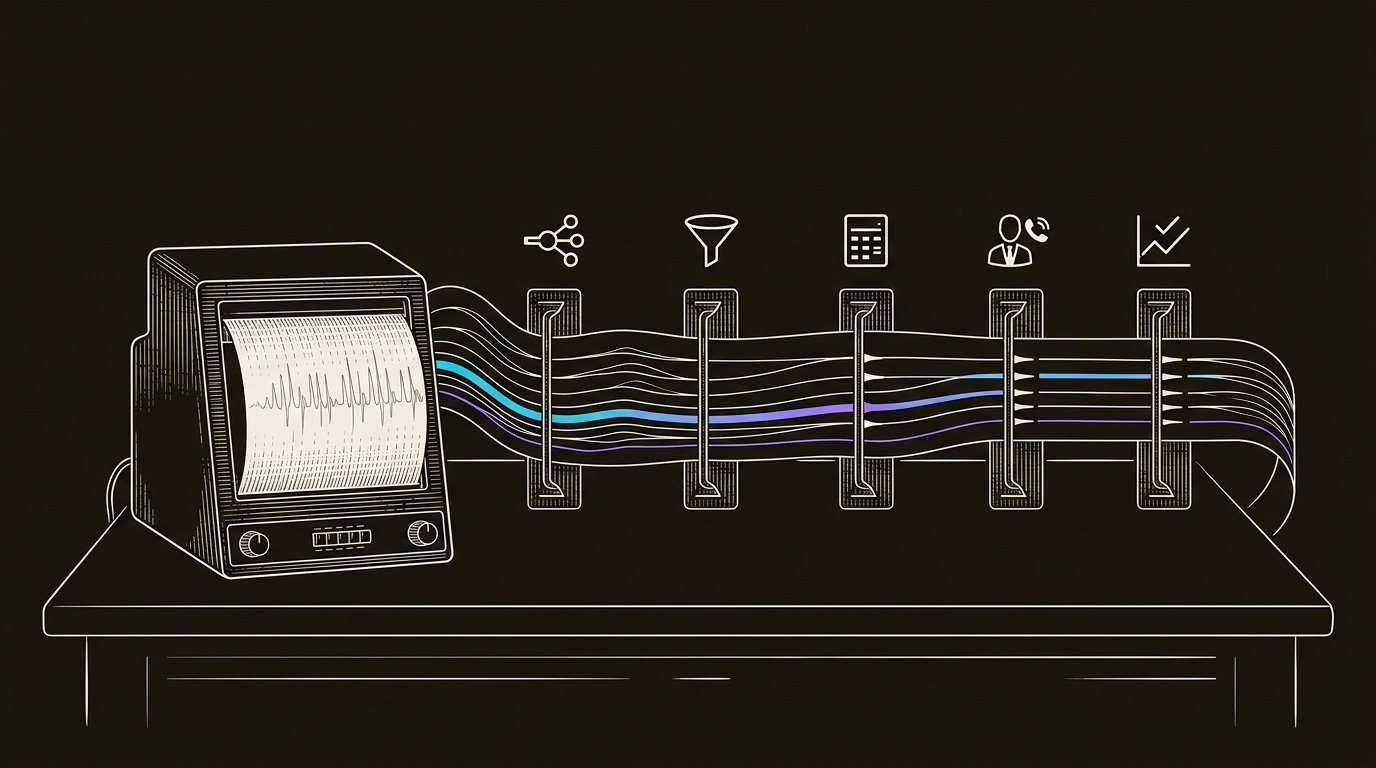
Running an outbound call center successfully means constantly improving your performance: and that can only happen through regularly tracking your outbound call center metrics. Once you know what to measure and how to interpret it, you can drive better results. Here are the five essential KPIs to track.
Most Essential Outbound Call Center Metrics to Measure
Every outbound call center can choose any performance metrics they believe are most valid for their business. Not sure what to track? Here are five valuable metrics to follow to reach your business goals.
1. Connection Rate
The connection rate defines the share of leads contacted (including voicemails) out of all calls made within a certain period. You can track it daily, weekly, or monthly. This KPI directly measures the efficiency of your lead list.
The better your lead list, the more leads you can reach within a given timeframe. If your connection rate is lower than you'd like, sharpen your ideal customer profile and invest in better prospect research before dialing. A good outbound connection rate typically falls between 15% and 25%; below 15% is a signal to improve data quality first.
To measure it, use this formula:
2. Conversion Rate
The conversion rate shows the percentage of calls that resulted in a closed deal versus all calls made within a given timeframe.
The faster you close a deal, the lower your cost per lead: and the higher the revenue your outbound call center generates. Here is the formula:
According to the RAIN Group, it takes an average of 8 touches to generate a conversion with a new prospect. Multi-channel outreach: combining calls with cold email sequences: helps you hit that target faster and more reliably.
3. Cost per Acquisition (CPA)
The cost per acquisition (CPA) indicates the average price paid for each converted lead. When calculating this metric, account for all resources and expenses involved in making the sale happen.
To measure it, use the formula:
Sales costs include the agent's hourly rate multiplied by billable hours. Marketing costs cover targeted ads, email campaigns, and other outreach expenses. Technical costs include outbound sales software, hardware, and special equipment.
4. Calls per Agent
This metric denotes the number of calls made by each SDR within a given period: an hour, a shift, or a week. It's critical for tracking individual performance and progress over time.
The calls-per-agent metric also helps managers evaluate whether the team can handle current workflow volume and whether it's time to hire or optimize. CIENCE works with 2,500+ clients across 250+ industries, and across those engagements, SDR teams that track calls per agent daily consistently outperform those reviewing only weekly.
Cold calling tips and techniques from CIENCE experts to
5. Call Quality
Call quality is measured using a 1-to-5 normative scale: with 1 being very poor and 5 being excellent. To measure this KPI, randomly select a statistically appropriate sample of calls and evaluate: how well the script was followed, how the sales pitch was delivered, how sales objections were handled, and what the call outcome was.
This is the most overlooked metric in outbound: and often the one with the highest use. Agents who receive regular call quality feedback improve faster and generate fewer spam-flagged calls, which protects your dialing reputation over time.
If your outbound is producing diminishing returns despite more tools and more reps, the problem isn't execution: it's architecture.
"The CIENCE team is aggressive in generating leads and continuously fine-tunes campaigns for success. Their expertise has been a game-changer for us.": Silicon Valley Insight, 500%+ increase in monthly appointments
CIENCE + graph8 pricing: $5,000 one-time GTM system setup, $2,499/mo strategic execution, and the graph8 platform at $499/mo. No long-term contracts. See full pricing to
Whether or not you decide to work with us, you'll walk away with a clear picture of where your pipeline is leaking and what it would take to fix it.
The list of outbound sales call center metrics is much more extensive than the five covered here. You don't need to track all of them: but keeping a tight eye on these essential KPIs is the most reliable path to consistent pipeline growth.
"They booked more calls than our internal team anticipated: and did it immediately.": Precision Analytics, on CIENCE outbound calling results

The five metrics only matter when they change the next action: better list, better follow-up, better cost control, better capacity, and better calls.
Frequently Asked Questions
What is a good connection rate for an outbound call center?
A good outbound connection rate typically falls between 15% and 25%, though this varies by industry and lead quality. The connection rate measures the share of leads contacted (including voicemails) out of all calls made. If your rate is below 15%, refine your ideal customer profile and invest in better data before dialing.
How many touches does it take to convert an outbound lead?
According to the RAIN Group, it takes an average of 8 touches to generate a conversion with a new prospect. These touches can include calls, emails, social media messages, and other outreach methods. Consistent multi-channel follow-up is essential for maximizing your conversion rate.
How do you measure call quality in an outbound center?
Call quality is measured using a normative scale: typically 1 to 5: by randomly sampling a statistically appropriate number of calls. Evaluators assess script adherence, sales pitch delivery, objection handling, and call outcomes. This metric boosts SDR motivation and can sharply improve sales results when tracked consistently.